


Why Most Stocks Are Losers and Why New Money Hits the Already-Wealthy First
(Bessembinder + Cantillon and the Ownership Divide)
2026.07.29
Philip Stuart Hammond, CFP®
TrendCalc Dynamics
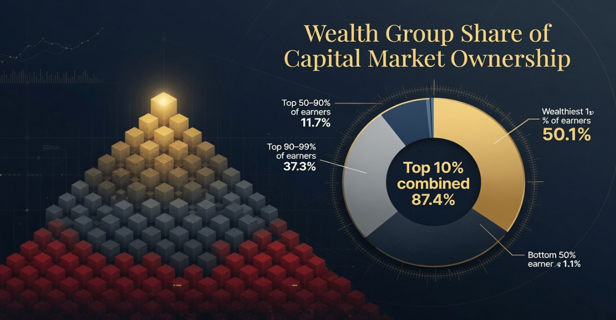
The Federal Reserve data showing the top 1% now own just over half of U.S. equities and mutual fund shares is not an accident of history. Two powerful, measurable forces help explain how that concentration formed and why it continues to widen: the extreme positive skewness of individual stock returns (Bessembinder) and the uneven path of newly created money through the economy (Cantillon).
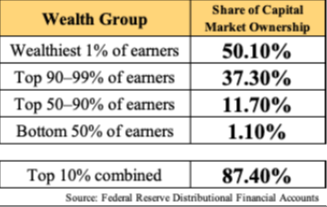
The current ownership picture is stark. The wealthiest 1% of U.S. earners now own 50.1% of U.S. equity and mutual fund holdings. To put this into perspective, their ownership stood at 40.1% in 1990 and 39.6% in 2001. At the same time, the next 9% wealthiest households own 37.3%, and the middle 40% own just 11.7%. By comparison, the bottom 50% of earners hold just 1.1%. As a result, the top 10% of earners now own roughly 87.4% of all equity and mutual fund assets.
Together, Bessembinder’s findings and the Cantillon effect reveal why the beliefs, risk tolerance, and decision rules of the wealthiest systematically produce different results from those sold to the masses.
1. Bessembinder: Most Stocks Are Dead Money
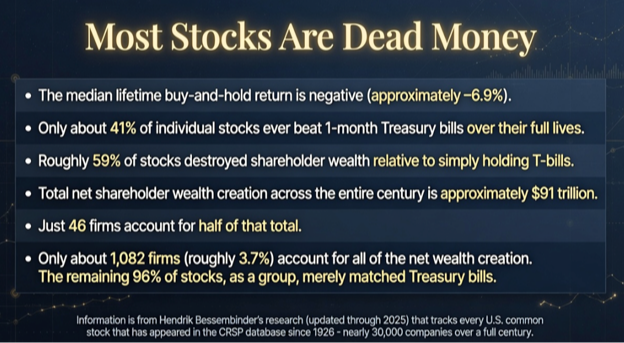
Hendrik Bessembinder’s research (updated through 2025) tracks every U.S. common stock that has appeared in the CRSP database since 1926 — nearly 30,000 companies over a full century.
The findings are blunt:
- The median lifetime buy-and-hold return is negative (approximately –6.9%).
- Only 41% of individual stocks ever beat 1-month Treasury bills over their full lives.
- Roughly 59% of stocks destroyed shareholder wealth relative to simply holding T-bills.
- Total net shareholder wealth creation across entire century is nearly $91Trillion.
- Just 46 firms account for half of that total.
- Only about 1,082 firms (~3.7%) account for all of net wealth creation. The remaining 96% of stocks, as a group, merely matched Treasury bills.
In short, the stock market’s long-run wealth creation is produced by a tiny minority of extreme winners. The vast majority of listed companies are, over their lifetimes, mediocre or worse.
This is not a temporary anomaly. The concentration has intensified in the last decade. In the original 1926–2016 study it took 89 firms to explain half the wealth creation. Adding the most recent nine years dropped that number to 46. Apple and Nvidia alone now account for roughly 10% of a century’s net wealth creation.
Behavioral implication
The conventional wisdom sold to the broad public treats the stock market as a relatively uniform “asset class.” Buy a broad index, dollar-cost average, hold for the long term, and you will capture “the market return.” That advice is not false for the average investor who lacks edge, time, or the emotional capacity for large drawdowns. Indexing automatically includes the tiny minority of winners and therefore produces respectable compounded returns for those who stay the course.
But it also means the absolute dollars of ownership remain modest for the middle and bottom of the wealth distribution. The extreme upside — the multi-trillion-dollar wealth creation events — accrues to those who either founded the winners, owned large concentrated positions especially early on, or held concentrated positions in a few firms that compounded at exponential alpha rates of return. This is visible in the ownership table and the historical trend: the top 1% alone now hold 50.1% (up from 39.6% in 2001 and 40.1% in 1990), and the next 9% add another 37.3%, leaving the bottom half with only 1.1%.
The wealthiest (as a group) operate from a higher level of knowledge and understanding intelligence, and as such, have a much more market professional decision-making model. Many built or kept concentrated exposure to businesses they understood. They accepted the high failure rate of individual positions because the upside of the winners is so large that a few successes more than compensate. The masses are actively discouraged (advised) from this approach and steered toward the broad, low-conviction “safer” diversification by the advice professionals charged with the fiduciary duty to serve the best interests of the investor client. The result is predictable: one group ends up owning the bulk of the equity value; the other owns a small residual share.
Bessembinder’s numbers do not prove that concentrated stock-picking is easy or advisable for most people. They prove that someone has to own the extreme winners for the market to generate its historical wealth creation. Those who already own large absolute positions in the winners, or who are willing and able to take concentrated risk, capture a disproportionate share of that creation — exactly as the 50.1% / 37.3% / 11.7% / 1.1% split (and the rise from the low-40% range in the 1990s–early 2000s) shows.
2. The Cantillon Effect: New Money Arrives Unevenly
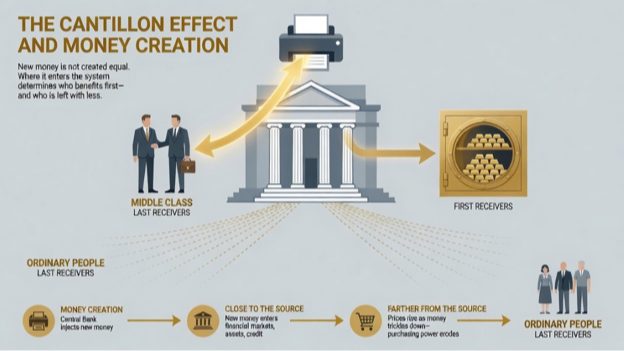
Richard Cantillon observed in the 1720s that newly created money does not raise all prices simultaneously or equally. It enters the economy at specific points. The first recipients spend it at the old price level and gain. Later recipients face higher prices before their own incomes adjust and lose.
In a modern fiat system the injection points are clear: central bank asset purchases, bank credit creation, and government deficit financing. The first recipients are overwhelmingly financial institutions, large asset holders, and those with access to cheap leverage against financial collateral.
Empirical patterns match the theory:
- Periods of rapid monetary expansion (especially post-2008 and 2020) coincide with sharp rises in equity and real-estate prices long before consumer prices fully adjust.
- Top 10% of households already own the large majority of equities (87.4%). When equity prices rise because of liquidity injections, that group captures the gains first.
- Wage earners and cash-heavy households experience the inflation later, often after asset prices have already re-rated. The bottom 50%, holding only 1.1% of the assets, largely miss the initial revaluation.
This is not conspiracy. It is the mechanical result of how money is created and who already owns the assets that reprice first. Monetary policy systematically transfers purchasing power toward existing owners of financial assets.
Behavioral implication
The wealthy treat balance sheets as tools for acquiring more assets. They use debt to buy productive claims (securities-backed lines, investment real estate, business leverage) at rates lower than the expected return on the assets. When new money inflates those asset prices, their net worth rises further — reinforcing the 50.1% share already held by the top 1% (itself a sharp rise from the 39.6–40.1% levels of 2001 and 1990).
The broader population is marketed a different use of debt: consumption, depreciating vehicles, and lifestyle smoothing. They are also sold the idea that “the market” will take care of them if they simply contribute regularly to diversified funds. That approach still benefits from equity ownership, but the scale is small (11.7% for the middle 40%, 1.1% for the bottom half) and the Cantillon transfer largely bypasses them.
The same monetary expansion that lifts the ownership shares of the top therefore widens the gap in real economic power.
How the Two Forces Reinforce the Decision Divide
Bessembinder shows that wealth creation inside the equity market is extremely skewed. Cantillon shows that the path of new money systematically favors those who already hold assets.
Put them together and the ownership data becomes less mysterious:
- Those who accept (or never fully internalize) the conventional retail philosophy end up with broad, passive exposure. They capture a share of the market’s average return, but their absolute ownership remains limited (the 11.7% + 1.1% segments).
- Those who operate with higher concentration, productive leverage, and a clearer understanding that most individual stocks fail — yet a few create almost everything — end up owning larger absolute positions in the winners. When new money arrives, those positions are the first to reprice, protecting and expanding the 50.1% and 37.3% shares that have grown steadily since the early 2000s.
The conventional wisdom is not a conspiracy against the middle class. It is a scalable, low-liability, high revenue product that fits the distribution and compliance machinery of the financial advice industry they work within and the government regulators and rule makers they serve and answer to. It largely just delivers market-average (or below average) results to people who follow it. The Market Professional Investor Approach starts from a different premise: that the extreme skewness of returns and the non-neutrality of money creation are features of the system, not bugs to be ignored or diversified away. Clients who internalize that reality make different decisions about concentration, leverage, and time horizon.
All of this — the ownership concentration shown in the table (50.1% / 37.3% / 11.7% / 1.1%, up sharply for the top 1% from 39.6% in 2001 and 40.1% in 1990), the advice and behavioral divergence, the marketing of passivity to the many while concentrated risk and productive leverage remain the province of the few — is the downstream result of a deeper first principle: a healthy distrust of the dictums, proclamations, guidance, advice, standards of care, and prudence handed down by central-planning authorities (government itself) and by the industries that operate under their rules — especially the investing and financial advice industry, the health/medical industry, and the food industry — combined with the recognition that everyone gets exactly what they want and deserve out of life based on the decisions they make and don’t make for themselves and their families, and on who or whom they choose and don’t choose to trust and entrust for information, guidance, and advice. The data does not require everyone to become a concentrated stock picker. It does require honesty about what produces the bulk of equity wealth creation, who is structurally positioned to capture it when new money enters the system, and the consequences that follow from the philosophy of capital each person accepts.
Most people never seriously examine who they have entrusted with their capital decisions or what those decisions have actually produced. The ownership numbers, the extreme skewness of returns, and the Cantillon transfer of purchasing power are not abstract theories — they are the measurable outcomes of millions of individual choices about risk, concentration, leverage, and trust. Look at your own equity holdings, including retirement accounts. What percentage is truly concentrated in high-conviction positions you understand versus broad, low-conviction index exposure sold as “prudent”? How much of your balance sheet is structured to acquire productive assets versus consume or depreciate? Compare that reality against the table above and against Bessembinder’s finding that a tiny fraction of firms create essentially all the net wealth. The gap is the cost of the philosophy you have accepted so far. If that gap is uncomfortable, the next decision is whether to keep following the same guidance or to adopt a market-professional approach that treats concentration, productive leverage, and realistic inflation accounting as features rather than risks to be diversified away. This is one piece of a larger examination of how conventional financial guidance, monetary policy, and personal decision-making interact. The same first principle applies far beyond portfolios. The data is clear. The philosophy that produced it remains optional.
Author Note
This is part of an ongoing series on TrendCalc.net examining how conventional frameworks have constrained real wealth creation — and how a more market professional investing approach can change the outcomes.
At my +60 age, when many in the advice professional business are winding down or fully retiring, I find myself more energized and purposeful than ever. After more than 40+ years as a financial advisor, I’ve made a deliberate shift from the conventional model I was initially taught and had once practiced to one centered on true wealth creation, client agency, and economic sovereignty. I have little personal interest in traditional retirement. Instead, I’m driven to help as many individuals and families as possible reach the “promise land” of transformative wealth — the kind that funds real steps up the ladder of life, higher living standards, and genuine financial independence and economic freedom.
My goal is to equip people with the knowledge, mindset, and decision-making frameworks to achieve abundance and purpose rather than settle into scarcity, stress, and fear of running out. Whether that happens directly through a client relationship or indirectly — by readers gaining the understanding and confidence to become far better investors and stewards of their own capital — the mission remains the same: to help as many others foster greater personal self-sovereignty, autonomy, and the freedom to live life on their own terms. What I’ve learned cannot be allowed to die with me; it must be shared so others can build stronger, more secure futures for themselves and their families.
Important Disclaimer
This article is provided for general educational and informational purposes only. It is not intended to provide personalized financial, investment, tax, legal, or other professional advice. The concepts, frameworks, and examples discussed are general in nature and may not be suitable for every individual’s unique financial situation, risk tolerance, or goals. Achieving financial independence, economic freedom, or any level of personal self-sovereignty depends on many factors, including market conditions, personal circumstances, and disciplined execution. Past performance is not indicative of future results. Readers should consult with a qualified financial advisor, tax professional, or other appropriate licensed professional before making any financial decisions. The author and publisher do not guarantee any specific outcomes and are not responsible for any losses or damages that may result from the application of the ideas presented.